Four Cities Forecast: Japan(July 30, 2010)

Previous posts in this series have shown a new type of experimental forecast for 4 major California cities exposed to seismic hazard. These forecasts are made in real time and will be updated frequently. In this posting, we extend these forecasts to 4 major cities in Japan. Future postings will develop forecasts for some of the world's other megacities (populations of millions) in seismically active regions.
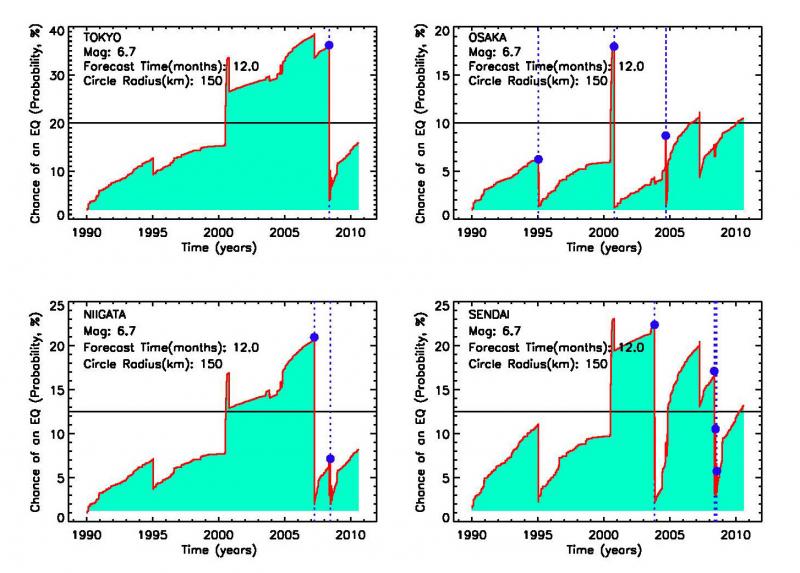
The cities examined here are Tokyo, Osaka, Niigata and Sendai on the island of Honshu in Japan. As always, we use the public, online ANSS seismic catalog maintained by the USGS and others. The caveats to these forecasts are as before. They are at present experimental, although we have good reasons for expecting the results are meaningful, since an integral component of the method is systematic backtesting using well-known reliability and receiver operating characteristic tests. In addition, since the quality of the data for Japan in the ANSS catalog is not as good as for California, the results cannot be expected to be quite as good in general as the results for California. With those qualifiers in mind the results are presented here.
The figures below show the probability in % that a magnitude M>6.7 earthquake might occur within 150 miles of the indicated city, within 1 year from now. In this forecasts, the depths of the expected earthquakes are restricted to less than 18.5 miles (30 km) which is a typical value for the thickness of the brittle crust. To better facilitate comparison, these figures are plotted together. The proper way to read the figure was given in the postings of July 8, 2010, and July 23, 2010, for the California forecast. As the reader can see, the probability generally increases until a major earthquake occurs (blue dot), at which time the probability decreases suddenly. Bursts of small earthquakes within the 150 mile circle lead to sudden increases of probability, while large earthquakes just outside the circle can lead to decreases in probability.
Of particular interest are the events apparently preceding the October 6, 2000 Western Honshu earthquake whose magnitude (Mw) was 6.7. At least 130 persons were injured, and over 100 homes were destroyed. On the figure below, this event was immediately preceded by swarms of smaller events in the volcanic Izu Islands, about 300 miles east from Osaka. The influence of these events led to the obvious sharp increase in probability in all four cities prior to the occurrence of the Western Honshu event, which occurred within the 150 miile circle around Osaka.
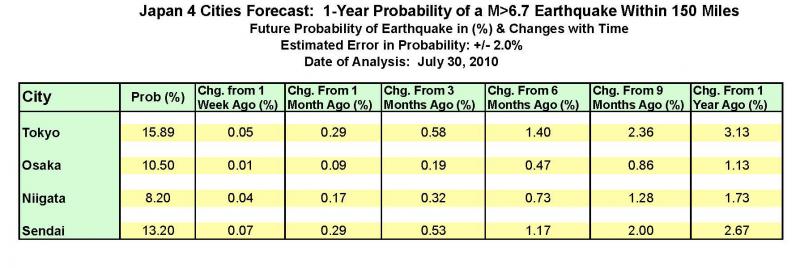
The figure above provides a good view of the long term change in probability, but what about the short term, say, over the past weeks and months? To convey this information, we provide the table below, which gives the probability in % in the first column with numbers, and the change in today's probability from its value 1 week ago, 1 month ago, 3 months ago, 6 months ago, 9 months ago, and 1 year ago.
 We also add the following. As explained in the earlier postings, this is an experimental forecast that better captures the time dependent increase in probability leading up to a large earthquake. The present forecast is a method that captures spatial probabilties well, but assumes relatively small temporal changes (you may have noticed this). It is essentially a Poisson-type forecast but modified to include the effects of aftershocks. The present forecast is also based on rates of occurrance of small earthquakes over long periods of time, similar to other current methods. Since rates of small earthquakes can be highly variable in time, large earthquakes are known to occur during periods of low as well as high rates of small earthquakes.
In more technical terms, this experimental forecast is a Weibull probability, which counts the number of small earthquakes since the last large earthquake as a means of determining how far the system has evolved towards the next large earthquake. It therefore measures the accumulation of small earthquakes as an indicator of when the next large earthquake might be, an idea that has not been used previously. It should also be noticed that this forecast has been applied to a circle of fixed radius around four cities (150 miles or 243 km), a fixed magnitude M>6.7, depth < 18.5 miles (30 km) and a fixed time period (1 year).
As the reader can see, this new forecast probability also has the feature that it starts out at a low value following the last large earthquake, generally increases through time, then decreases suddenly after the next large earthquake (although not to zero!). So this new model predicts that while a few large earthquakes will occur soon after the last one, most will occur at much longer times (typically years) after the last one. Generally speaking, the elastic rebound theory of earthquakes, first formulated in 1910 by Harry Fielding Reid, predicts just this type of behavior. The decrease in probability is due to the fact that a large earthquake relieves stress in the immediate region, thereby decreasing the tendency for other large earthquakes to occur in the same area within a short span of time.
About OpenHazards Bloggers
 Steven Ward is a Research Geophysicist at
the Institute of Geophysics and Planetary Physics, UC Santa Cruz. He specializes in the quantification and simulation of
natural hazards. Read Steve's blog.
Steven Ward is a Research Geophysicist at
the Institute of Geophysics and Planetary Physics, UC Santa Cruz. He specializes in the quantification and simulation of
natural hazards. Read Steve's blog.
 John Rundle is a Distinguished Professor of Physics
and Geology at UC Davis and
the Executive Director of the APEC Collaboration for Earthquake Simulations. He
chaired the Board of Advisors for the Southern California Earthquake Center from 1994 to 1996. Read John's blog.
John Rundle is a Distinguished Professor of Physics
and Geology at UC Davis and
the Executive Director of the APEC Collaboration for Earthquake Simulations. He
chaired the Board of Advisors for the Southern California Earthquake Center from 1994 to 1996. Read John's blog.
Comments
In this cutting edge with the help of latest technology people able to get acknowledge about earth quake hazard before and can save people through. That is quite informative you write a paper for me content forecast to share with us about the Japan.
cascasca
I still can't forget that Japan earthquake that was an end to my college days and I was searching for http://essaysmama.com when I heard that Japan had severed earthquake and it damage a lot, it is almost seven years passed and I still can't forget it.