Four Cities Forecast: California Update July 28, 2010

The charts below are an update of the four cities forecast for California. Previous updates to this forecast can be found in postings on July 8, 2010 and July 23, 2010. Detailed explanations and details of how to read these charts can be found there.
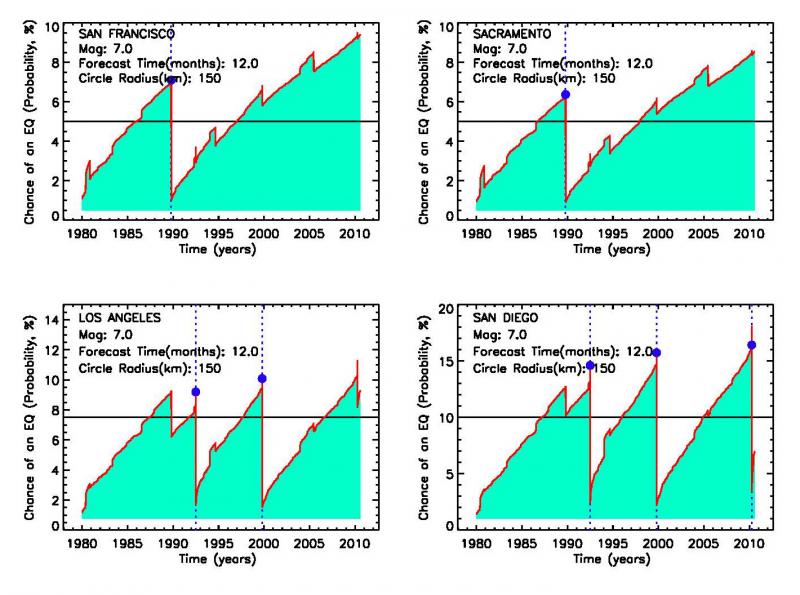
This update is a part of a continuing series of postings for earthquake forecasts for major cities in California and around the world that are subject to earthquake risk. The figure below shows the probability in % that a magnitude M>7 earthquake might occur within 150 miles of the indicated city, within 1 year from now. To better facilitate comparison, these figures are plotted together. As the reader can see, the probability generally increases until a major earthquake occurs (blue dot), at which time the probability decreases suddenly. Bursts of small earthquakes within the 150 mile circle lead to sudden increases of probability, while large earthquakes just outside the circle can lead to decreases in probability.
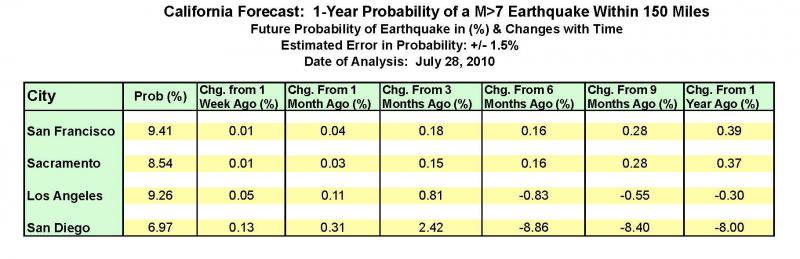
The figure above provides a good view of the long term change in probability, but what about the short term, say, over the past weeks and months? To convey this information, we provide the table below, which gives the probability in % in the first column with numbers, and the change in today's probability from its value 1 week ago, 1 month ago, 3 months ago, 6 months ago, 9 months ago, and 1 year ago. Readers of this post should compare the values in the table below to the values in the last posting of July 23, 2010. It can be seen that systematic changes are occurring as time passes, as also reflected in the figures above.
About OpenHazards Bloggers
 Steven Ward is a Research Geophysicist at
the Institute of Geophysics and Planetary Physics, UC Santa Cruz. He specializes in the quantification and simulation of
natural hazards. Read Steve's blog.
Steven Ward is a Research Geophysicist at
the Institute of Geophysics and Planetary Physics, UC Santa Cruz. He specializes in the quantification and simulation of
natural hazards. Read Steve's blog.
 John Rundle is a Distinguished Professor of Physics
and Geology at UC Davis and
the Executive Director of the APEC Collaboration for Earthquake Simulations. He
chaired the Board of Advisors for the Southern California Earthquake Center from 1994 to 1996. Read John's blog.
John Rundle is a Distinguished Professor of Physics
and Geology at UC Davis and
the Executive Director of the APEC Collaboration for Earthquake Simulations. He
chaired the Board of Advisors for the Southern California Earthquake Center from 1994 to 1996. Read John's blog.
Comments
Around the world, the number of natural disasters occurs and because of latest technology we get acknowledge about early. The government must take action and acknowledge people about or shift them at a safe point. I found pretty helpful material on NinjaEssays review website thanks for having it.
The author is discussing the showing pack sack in which at some point he hold books and some other things.They are doing these sort of https://techiepapers.com/ since this is helping for their understudies. They need that their understudies turn into a decent understudies.
Is this pattern occurring around the San Andreas fault in southern California? While not a strict quantitative description of activity, the Mogi donut idea is a useful concept for characterizing qualitatively the behavior of major earthquakes in southern California during the last 30 years or so. fnaf game demo.