A New Type of Forecast

The recent April 4, 2010 M7.2 Mexicali earthquake has been the subject of considerable analysis and speculation. It occurred at a location of high probability in the California border region with Mexico, as shown by the Open Hazards viewer (available under the Tools tab). And while the baseline forecast on this web site does an excellent job of forecasting locations of major events, we are continually seeking to improve our forecast technology, particularly to better capture times of heightened probability. In that spirit, we have been experimenting with another type of space-time forecast.
This new calculation is fundamentally based on the idea that large numbers of small earthquakes in space and time are often associated with the occurrence of large earthquakes, an observation first documented in 1942 by Beno Gutenberg and Charles Richter. When combined with established methods of statistical testing that can be used to select the best forecast from among a group of candidate forecasts, we can calculate values such as are shown below. We note that these methods are still being improved, and the results should be regarded as preliminary.
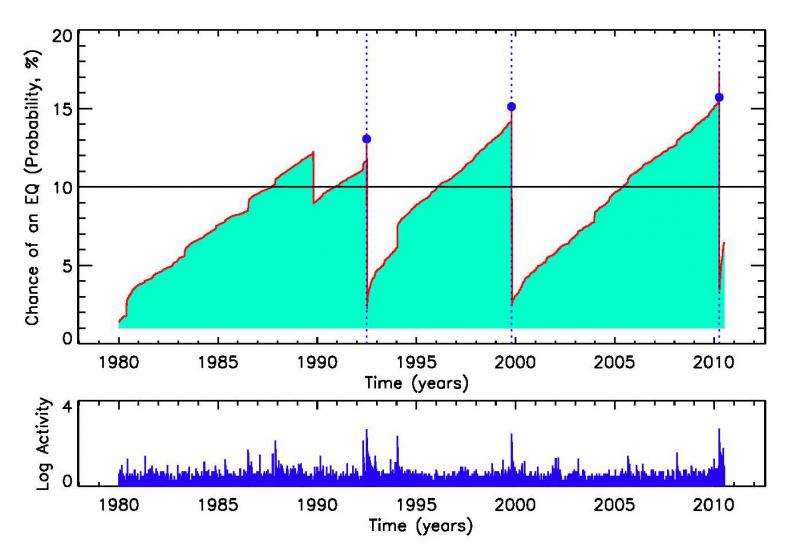
The upper figure is a plot of the chance or probability in % of an earthquake of magnitude M > 7 occurring within 150 miles of San Diego during the next year. The plot covers the entire time period from 1980 up until the present. The way to read this plot is to pick a time, for example, 1995 on the horizontal axis. Moving vertically up to the red line from the year 1995, we find the spot on the red line at that time. From that spot, go horizontally over to either side, and see that the chance of an earthquake is about 8% during the next year. This means that the method calculates that, at the beginning of 1995, it was projected that there was an 8% chance that an M>7 earthquake would occur within 150 miles of San Diego during the period January 1, 1995 to Dec 31, 1996. You can also see 3 dates, indicated by blue dots and blue dotted lines, at which the probability curve drops suddenly to a level of about 3%. These dates were the times of the 1992 Landers earthquake (M7.3), the 1999 Hector Mine earthquake (M7.2), and the 2010 Mexicali earthquake.
The sudden drop in the probability curve is associated with the decrease in tectonic stresses following a major earthquake, consequently the chance of another such large earthquake decreases suddenly as well (but not to zero!). Then, in a gradual process of tectonic stress accumulation, the probability increases gradually until the next earthquake occurs. We calculate these curves by tracking and counting the number of small earthquakes since the last large earthquake.
The most interesting part of the curve is at the right hand side, following the April 4 Mexicali earthquake (last blue dot). Although the probability of another M>7 earthquake has been reduced, it can be seen that the rate of recovery of probability is very fast, much faster than what is seen in the previous two large earthquakes. This rapid recovery is indicated by the large number of small earthquakes ("earthquake storm") that have been occurring in the southern California region since April 4. The calculation shows that currently, there is about a 7% chance that an earthquake having magnitude M>7 will occur within 150 miles of San Diego during the next year (i.e., from July 2010 until June 2011).
The lower plot in the figure is a record of the number of small earthquakes within the 150 mile circle centered on San Diego between 1980 and the present. The largest blue "spikes" are associated with the large numbers of small earthquakes that happen in association with large and major earthquakes. Technically, the height of the blue spikes are computed as the base-10 logarithm of the number of earthquakes that occur during each 3.7-day period. By following the largest spikes up vertically to the top plot, it can be seen that the 3 M>7 earthquakes were all associated with a large number of small earthquakes. But the Mexicali earthquake seems to stand out as having the greatest number of small aftershocks.
Below is a similar forecast calculation for earthquakes with magnitude M>6 within about 100 miles of San Diego, within 1 year from now. The current probabilty of approximately 30% is due in part to the significant number of smaller earthquakes that have occurred since the last M>6 earthquake in the
area, the Northridge earthquake in 1994.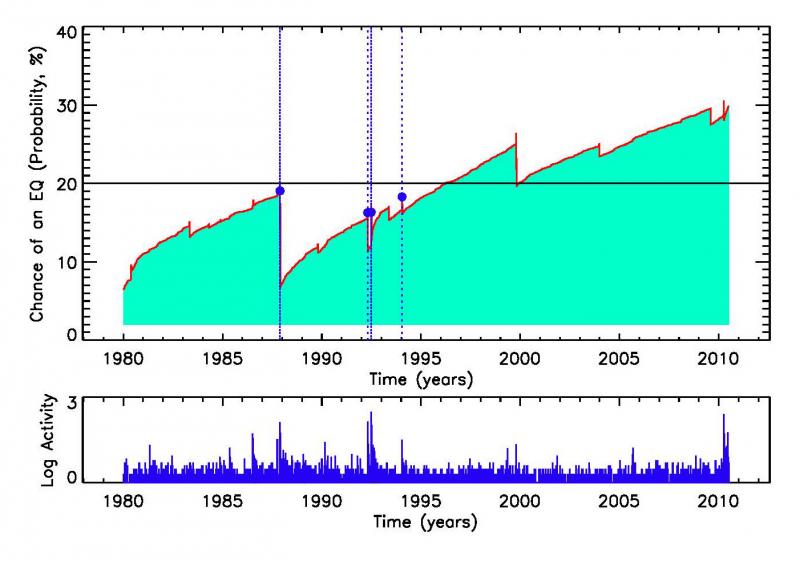
About OpenHazards Bloggers
 Steven Ward is a Research Geophysicist at
the Institute of Geophysics and Planetary Physics, UC Santa Cruz. He specializes in the quantification and simulation of
natural hazards. Read Steve's blog.
Steven Ward is a Research Geophysicist at
the Institute of Geophysics and Planetary Physics, UC Santa Cruz. He specializes in the quantification and simulation of
natural hazards. Read Steve's blog.
 John Rundle is a Distinguished Professor of Physics
and Geology at UC Davis and
the Executive Director of the APEC Collaboration for Earthquake Simulations. He
chaired the Board of Advisors for the Southern California Earthquake Center from 1994 to 1996. Read John's blog.
John Rundle is a Distinguished Professor of Physics
and Geology at UC Davis and
the Executive Director of the APEC Collaboration for Earthquake Simulations. He
chaired the Board of Advisors for the Southern California Earthquake Center from 1994 to 1996. Read John's blog.
Comments
Chances are always available for an upcoming earthquake. I've also been to the http://www.writemyessay-site.com/bestessays-com-review/ as well and they've been helping me out learn more about those situations. The results are shocking.
It looks like the probability is gaining strength and there's one expected soon. The denver granite team's installed strong, sturdy granite in my home and that's really, really good as well.