Site Specific Hurricane Wind Forecast – Katia

I recently posted a large number of probabilistic wind forecasts for Hurricane Irene. Here are similar predictions for Hurricane Katia - Maximum Sustained Wind expected at 25% probability.
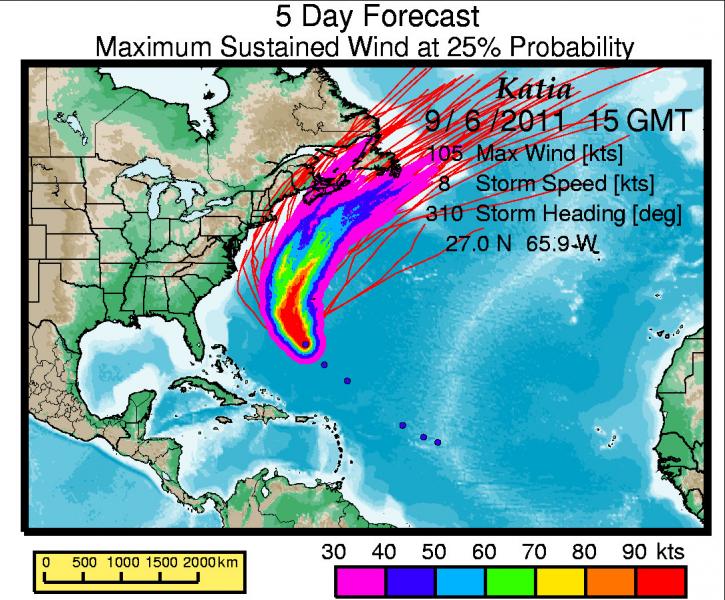
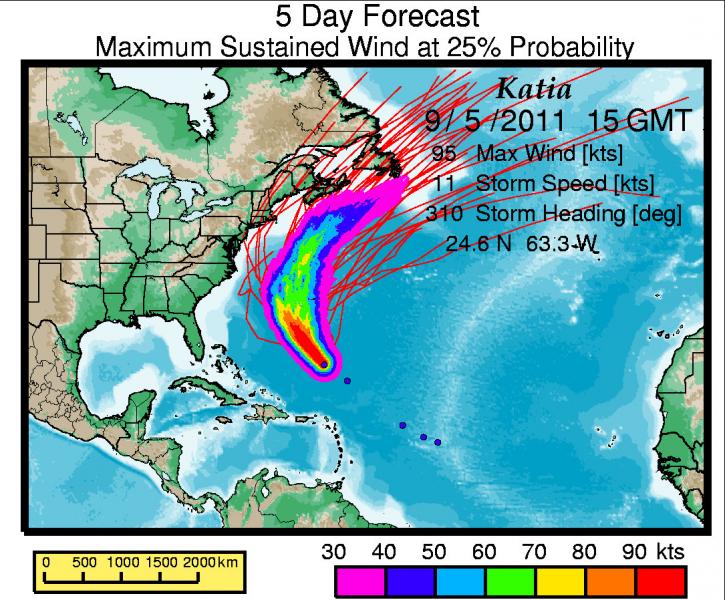
A twist to these calculations are "Site Specific Wind Forecasts". Given a latitude and longitude of a forecast location (your house?), you can run out a large number of potential storm tracks and storm strengths, then plot wind versus future time for each storm at the forecast location. These wind curves then, form the basis for a statistical forecast specific to the site. Below are my forecasts at Bermuda for Hurricane Katia at 9/5/2011 15 GMT. And 9/6/2011 15 GMT. Note shift of the curves to the left as the storm gets closer.


The red, orange and yellow lines are the 95%, 75% and 50% exceedence levels. That is, the maximum sustained wind level at the given time and location that is expected to be exceeded at 5%, 25% and 50% probability. Yellow boxes at right give probability of exceedence for any time during the 5 day window. Wind strength, onset time, duration, and probability are the elements needed for informed wind hazard decisions.
Steven N. Ward Santa Cruz
About OpenHazards Bloggers
 Steven Ward is a Research Geophysicist at
the Institute of Geophysics and Planetary Physics, UC Santa Cruz. He specializes in the quantification and simulation of
natural hazards. Read Steve's blog.
Steven Ward is a Research Geophysicist at
the Institute of Geophysics and Planetary Physics, UC Santa Cruz. He specializes in the quantification and simulation of
natural hazards. Read Steve's blog.
 John Rundle is a Distinguished Professor of Physics
and Geology at UC Davis and
the Executive Director of the APEC Collaboration for Earthquake Simulations. He
chaired the Board of Advisors for the Southern California Earthquake Center from 1994 to 1996. Read John's blog.
John Rundle is a Distinguished Professor of Physics
and Geology at UC Davis and
the Executive Director of the APEC Collaboration for Earthquake Simulations. He
chaired the Board of Advisors for the Southern California Earthquake Center from 1994 to 1996. Read John's blog.
Comments
This data sheets shows us the how deadly that hurricane Katia can be when it is in full swing. When we deal with natural calamities like these we cannot estimate the nature of it. According to http://superiorpapers.org blogs suggestion Those colored lines indicate the difference of wind speed and compare them with old ones.
I appreicate the work done and its cool mobogenie pc
Pleasant article. Think so new type of elements have incorporated into your article. Sitting tight for your next article. Roshani