Update July 23, 2010: Earthquake Forecasts for Four California Cities

In earlier postings, we have shown examples of some new kinds of forecasts that give promise for better capturing the time dependence of earthquake probabilities and forecasts of future activity. Again, these foreasts should be regarded as experimental at this time. These were posted on July 8 and July19, 2010. In this post we continue this process by posting a comparison of 1 year experimental forecasts for four California cities, together with a table that provides numerical comparisons.
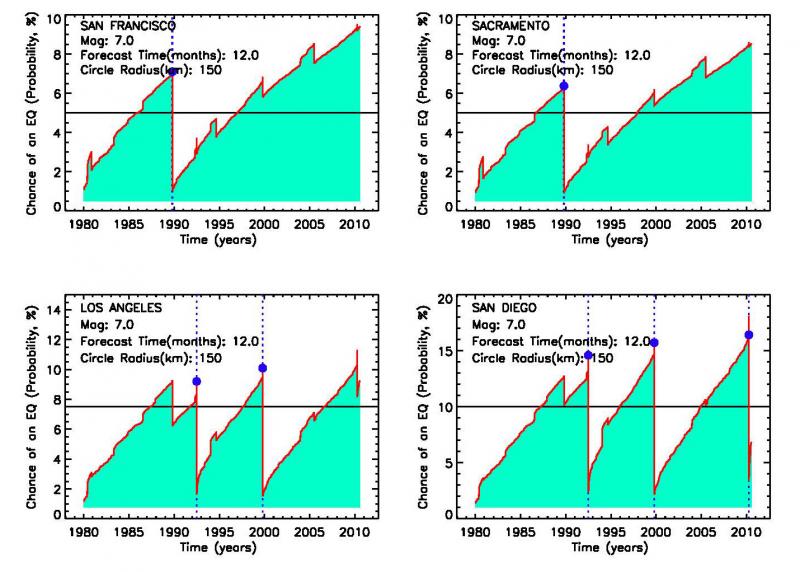
The figure below shows the probability in % that a magnitude M>7 earthquake might occur within 150 miles of the indicated city, within 1 year from now. To better facilitate comparison, these figures are plotted together. The proper way to read the figure was given in the posting of July 8, 2010. As the reader can see, the probability generally increases until a major earthquake occurs (blue dot), at which time the probability decreases suddenly. Bursts of small earthquakes within the 150 mile circle lead to sudden increases of probability, while large earthquakes just outside the circle can lead to decreases in probability.
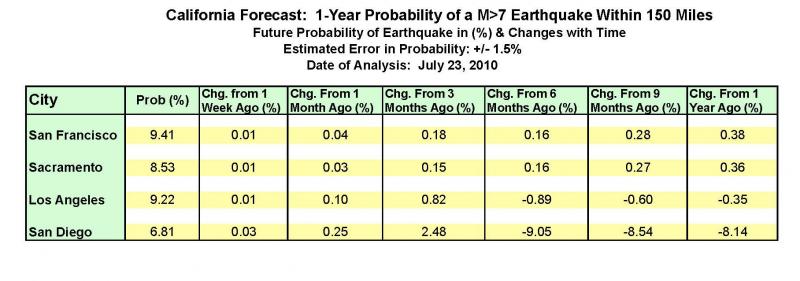
 The figure above provides a good view of the long term change in probability, but what about the short term, say, over the past weeks and months? To convey this information, we provide the table below, which gives the probability in % in the first column with numbers, and the change in today's probability from its value 1 week ago, 1 month ago, 3 months ago, 6 months ago, 9 months ago, and 1 year ago.
For example, for the probability that an M>7 earthquake might occur within 150 miles radius around San Francisco, within 1 year from now, is given in the table as 9.41%. The change from 1 week ago is 0.01, meaning that the 1-year probability computed last week was 9.40%. 1 month ago, the 1-year probability was 9.37% corresponding to a change of 0.04%. 3 months ago, the 1-year probability was 9.23% corresponding to a change of 0.18%, and so on. This indicates the probability is increasing with time, leading up to the eventual next earthquake in the future.
Examination of the table shows that for San Francisco and Sacramento, the 1-year probabilty has steadily increased over the past year, while for Los Angeles and San Diego, the 1-year probability has decreased from 6 months ago. This decrease is due to the April 4, 2010 Mexicali (Easter sunday) M7.2 earthquake. Following the sudden decrease at the time of the earthquake, the 1-year probability has begun to increase again to the current values of 9.22% (Los Angeles) and 6.81% (San Diego).
The reader should note that the current 1-year probabilities of 9.41% (San Francisco), 8.53% (Sacramento), 9.22% (Los Angeles), and 6.81% (San Diego) correspond to the vertical values of the red curves in the four plots above when measured at the extreme right hand end of the plots.
About OpenHazards Bloggers
 Steven Ward is a Research Geophysicist at
the Institute of Geophysics and Planetary Physics, UC Santa Cruz. He specializes in the quantification and simulation of
natural hazards. Read Steve's blog.
Steven Ward is a Research Geophysicist at
the Institute of Geophysics and Planetary Physics, UC Santa Cruz. He specializes in the quantification and simulation of
natural hazards. Read Steve's blog.
 John Rundle is a Distinguished Professor of Physics
and Geology at UC Davis and
the Executive Director of the APEC Collaboration for Earthquake Simulations. He
chaired the Board of Advisors for the Southern California Earthquake Center from 1994 to 1996. Read John's blog.
John Rundle is a Distinguished Professor of Physics
and Geology at UC Davis and
the Executive Director of the APEC Collaboration for Earthquake Simulations. He
chaired the Board of Advisors for the Southern California Earthquake Center from 1994 to 1996. Read John's blog.
Comments
As we all know that earthquake comes every year so it is the responsibility of the government that takes all precautionary arrangements for this well before time. But every year we talk about best essays a lot but do nothing.