It's Hard to Forecast Earthquakes When There are No Data: The Canterbury Tales

Yesterday's magnitude 6.3 earthquake near Christchurch, NZ was the second major earthquake to strike that city in the past 6 months. The previous event was the magnitude 7.1 earthquake that occurred on 4 September, 2010.
Both earthquakes did significant damage to Christchurch, one of the largest cities in New Zealand. With a population in excess of 350,000 persons, Christchurch is a popular tourist destination, as well as the jumping-off location for expeditions to Antarctica. While the 4 September earthquake caused no fatalities, yesterday's earthquake was much more deadly. As of today, it was estimated that at least 65 persons perished, with the death toll like to rise higher in coming days as the rubble is cleared away.
Although larger, the 4 September event occurred 10 km or so away from Christchurch, at a depth of about 10 km. Moreover, the larger earthquake struck in the early morning hours, when most of the public was asleep indoors. Yesterday's earthquake was located much nearer to the city, at a shallower depth of 5 km. Most significantly however, yesterday's event struck in the early afternoon when the streets were crowded.
How well was this earthquake anticipated? It was clearly an aftershock of the 4 September event, and as such was not surprising. The current "Poisson" type forecast that can be seen on the hazard viewer tool on this site indicates that both events occurred in a zone of moderate, but not high, probability. This type of forecast is consistent with the moderate rate of seismicity that can be seen in the online earthquake data base, the Advanced National Seismic System (ANSS).
However, like the situation in Haiti, a moderate rate of seismicity is unexpected, given that both areas are well known to be seismically active. Why the discrepancy?
Surprisingly, the answer lies in the fact that the online seismic database is incomplete in many areas. While this state of affairs might be reasonable in a poor country like Haiti, it should never occur for a developed country like New Zealand.
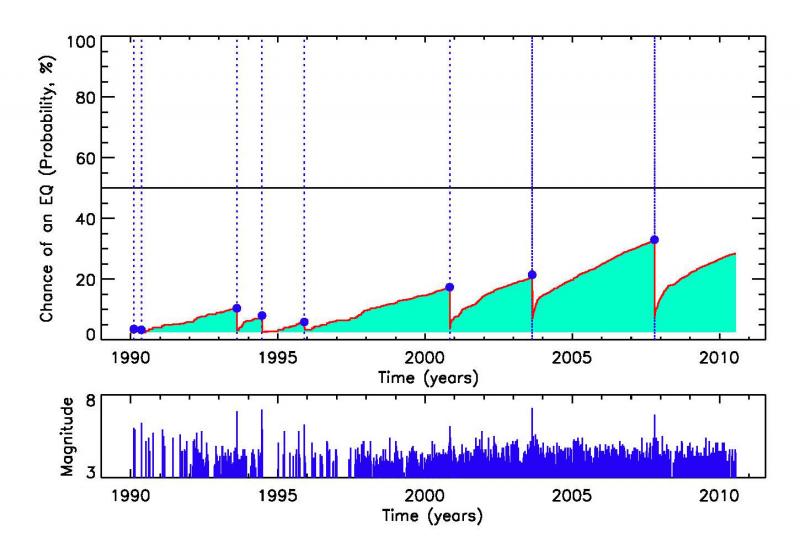
We can illustrate the problem using the new forecast technology, similar to that about to be deployed on this web site. The top figure below is a computation of the probability of earthquakes with magnitudes of 6.0 or larger for 1 year in advance of the date indicated on the horizontal axis.
The vertical axis shows the chance of an earthquake during the next year, and is shown as the red line over the period from 1990 to present. The geographical location to which the forecast pertains is a circle of radius 300 miles surrounding Christchurch. The small blue dots denote the earthquakes of magnitude larger than 6.0 that occurred during the years from 1990 to present. It can be seen that probability decreases sharply just after the latest large earthquake occurs, followed by a gradual increase leading up to the next large event.
The bottom figure below shows the magnitude of events in the 300 mile circle, occurring during the time interval from 1990 to present.
There are several striking features of this figure. The first is that in the top figure, the probability during the 1990's is small, but becomes systematically larger during the years after 2000. Correspondingly, the bottom figure shows that there are relatively fewer events in the 1990's than in the 2000's. Is this real? The simple answer is, almost certainly not. The catalog is clearly incomplete. Many earthquakes are missing in the early years.
An even more striking fact can be seen at the right hand end of the figure. The data completely cuts off after July 2010. There are no earthquakes after that date, not even the 4 September magnitude 7.1 event. The general trend of the red curve in the top figure clearly shows that a major event was approaching, but the lack of data after July, and even up until today, made a bad situation considerably worse.
It's tough to forecast earthquakes when there are no data !
About OpenHazards Bloggers
 Steven Ward is a Research Geophysicist at
the Institute of Geophysics and Planetary Physics, UC Santa Cruz. He specializes in the quantification and simulation of
natural hazards. Read Steve's blog.
Steven Ward is a Research Geophysicist at
the Institute of Geophysics and Planetary Physics, UC Santa Cruz. He specializes in the quantification and simulation of
natural hazards. Read Steve's blog.
 John Rundle is a Distinguished Professor of Physics
and Geology at UC Davis and
the Executive Director of the APEC Collaboration for Earthquake Simulations. He
chaired the Board of Advisors for the Southern California Earthquake Center from 1994 to 1996. Read John's blog.
John Rundle is a Distinguished Professor of Physics
and Geology at UC Davis and
the Executive Director of the APEC Collaboration for Earthquake Simulations. He
chaired the Board of Advisors for the Southern California Earthquake Center from 1994 to 1996. Read John's blog.